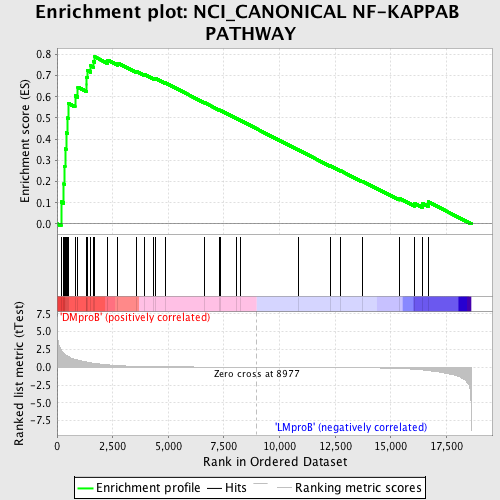
Profile of the Running ES Score & Positions of GeneSet Members on the Rank Ordered List
| Dataset | Set_04_DMproB_versus_LMproB.phenotype_DMproB_versus_LMproB.cls #DMproB_versus_LMproB |
| Phenotype | phenotype_DMproB_versus_LMproB.cls#DMproB_versus_LMproB |
| Upregulated in class | DMproB |
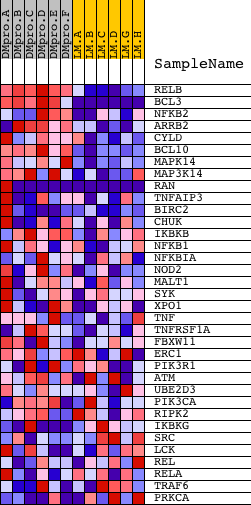
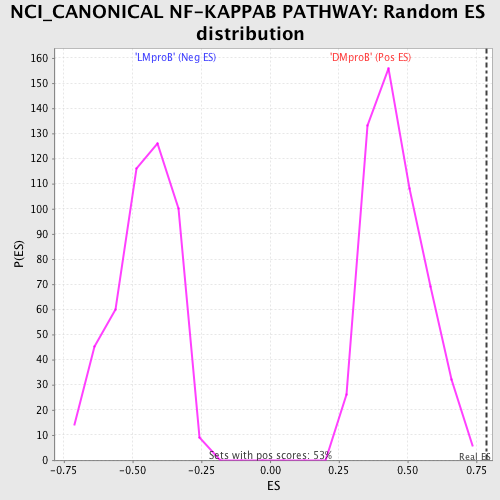
| GeneSet | NCI_CANONICAL NF-KAPPAB PATHWAY |
| Enrichment Score (ES) | 0.7885509 |
| Normalized Enrichment Score (NES) | 1.7246503 |
| Nominal p-value | 0.0 |
| FDR q-value | 0.028730474 |
| FWER p-Value | 0.092 |
| PROBE | DESCRIPTION (from dataset) | GENE SYMBOL | GENE_TITLE | RANK IN GENE LIST | RANK METRIC SCORE | RUNNING ES | CORE ENRICHMENT | |
|---|---|---|---|---|---|---|---|---|
| 1 | RELB | 17942 | 179 | 2.396 | 0.1040 | Yes | ||
| 2 | BCL3 | 8654 | 305 | 1.927 | 0.1886 | Yes | ||
| 3 | NFKB2 | 23810 | 341 | 1.794 | 0.2717 | Yes | ||
| 4 | ARRB2 | 20806 | 357 | 1.753 | 0.3540 | Yes | ||
| 5 | CYLD | 18532 | 405 | 1.659 | 0.4301 | Yes | ||
| 6 | BCL10 | 15397 | 471 | 1.553 | 0.5002 | Yes | ||
| 7 | MAPK14 | 23313 | 503 | 1.495 | 0.5694 | Yes | ||
| 8 | MAP3K14 | 11998 | 807 | 1.093 | 0.6049 | Yes | ||
| 9 | RAN | 5356 9691 | 933 | 1.000 | 0.6456 | Yes | ||
| 10 | TNFAIP3 | 19810 | 1333 | 0.722 | 0.6584 | Yes | ||
| 11 | BIRC2 | 4397 4398 | 1334 | 0.722 | 0.6926 | Yes | ||
| 12 | CHUK | 23665 | 1368 | 0.706 | 0.7243 | Yes | ||
| 13 | IKBKB | 4907 | 1513 | 0.621 | 0.7460 | Yes | ||
| 14 | NFKB1 | 15160 | 1638 | 0.564 | 0.7660 | Yes | ||
| 15 | NFKBIA | 21065 | 1694 | 0.538 | 0.7886 | Yes | ||
| 16 | NOD2 | 6384 | 2275 | 0.332 | 0.7731 | No | ||
| 17 | MALT1 | 6274 | 2732 | 0.225 | 0.7592 | No | ||
| 18 | SYK | 21636 | 3556 | 0.125 | 0.7209 | No | ||
| 19 | XPO1 | 4172 | 3925 | 0.101 | 0.7058 | No | ||
| 20 | TNF | 23004 | 4343 | 0.080 | 0.6872 | No | ||
| 21 | TNFRSF1A | 1181 10206 | 4442 | 0.076 | 0.6855 | No | ||
| 22 | FBXW11 | 20926 | 4860 | 0.062 | 0.6660 | No | ||
| 23 | ERC1 | 1013 17021 995 1136 | 6634 | 0.027 | 0.5718 | No | ||
| 24 | PIK3R1 | 3170 | 7282 | 0.019 | 0.5379 | No | ||
| 25 | ATM | 2976 19115 | 7356 | 0.018 | 0.5348 | No | ||
| 26 | UBE2D3 | 7253 | 8041 | 0.010 | 0.4985 | No | ||
| 27 | PIK3CA | 9562 | 8241 | 0.008 | 0.4882 | No | ||
| 28 | RIPK2 | 2528 15935 | 10837 | -0.019 | 0.3494 | No | ||
| 29 | IKBKG | 2570 2562 4908 | 12271 | -0.038 | 0.2741 | No | ||
| 30 | SRC | 5507 | 12732 | -0.046 | 0.2515 | No | ||
| 31 | LCK | 15746 | 13709 | -0.070 | 0.2023 | No | ||
| 32 | REL | 9716 | 15371 | -0.171 | 0.1210 | No | ||
| 33 | RELA | 23783 | 16057 | -0.286 | 0.0977 | No | ||
| 34 | TRAF6 | 5797 14940 | 16432 | -0.382 | 0.0957 | No | ||
| 35 | PRKCA | 20174 | 16682 | -0.460 | 0.1041 | No |